
In this walkthrough, you will learn how to create a report that is based on two tables. The report lists customers and their orders, and it is based on the Customer and Sales Line tables. This type of report can be used to get an overview of the current customer orders. This walkthrough is based on the Walkthrough: Designing a Customer List Report topic.
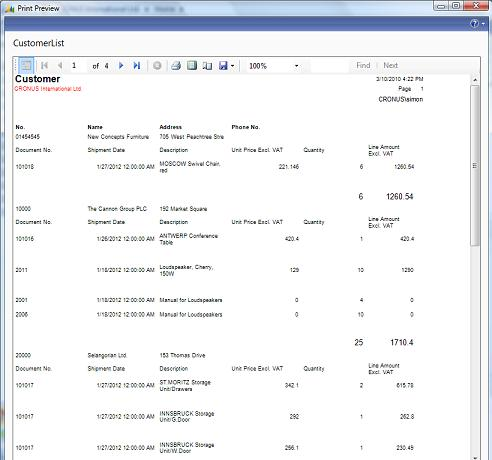
The following illustration shows the client report definition (RDLC) layout that you create in this walkthrough.
 About this Walkthrough
This walkthrough provides an overview of how to create a report that is based on two tables with Microsoft Dynamics NAV 2009 and design both the Classic layout of this report in Report Designer and the RDLC layout in Visual Studio. This walkthrough illustrates the following tasks:
-
Modifying the dataset of an existing report in Microsoft Dynamics NAV.
-
Adding fields to the Classic report layout.
-
Redesigning the RDLC report layout in Visual Studio Report Designer to add fields.
-
Adding grouping and totaling to the Classic report layout
-
Adding grouping and totaling to the RDLC report layout in Visual Studio Report Designer.
-
Running the modified report.
Prerequisites
To complete this walkthrough, you will need:
-
Microsoft Dynamics NAV 2009 with a developer license.
-
The CRONUS International Ltd. demo data company.
-
Visual Studio. For more information about versions of Visual Studio that you can use, see Requirements for Developing Reports for the RoleTailored Client.
-
Completion of Walkthrough: Designing a Customer List Report.
Modifying the Dataset of an
Existing Report
You add an additional Microsoft Dynamics NAV table to the dataset of the existing customer list report.
To modify the dataset of an existing report
-
In the Classic client, on the Tools menu, click Object Designer.
-
In Object Designer, click Report, and then locate the CustomerList report with ID 55551.
-
Click the Design button.
-
In the Data Item field, enter the Sales Line table as the second data item.
-
Select the Sales Line data item, and then click the right-arrow button once to indent it. Indenting the data item specifies that the records in the Sales Line data item are combined in an inner join with the records in the Customer data item.
-
On the View menu, click Properties to open the Properties window for the Sales Line data item.
-
Set the DataItemLinkReference property to Customer. This specifies that the Sales Line data item is linked to the Customer data item. This is the default setting because you indented the Sales Line data item below the Customer data item.
-
To specify the field in the Sales Line data item and the field in the Customer data item that are linked, do the following:
-
In the Value field of the DataItemLink property, click the drop-down arrow to open the DataItem Link window.
-
In the Field field, enter the name of the field from the Sales Line table that must correspond to a field from the Customer table. For this report, select the Sell-to Customer No. field.
-
In the Reference Field field, enter the name of the field from the Customer table that corresponds to the field from the Sales Line table. For this report, select the No. field, and then click OK.
-
-
Open the Properties window for the Customer data item, and then set the PrintOnlyIfDetail property to Yes to only print the Customer body section if there is data to print from the Sales Line table.
-
Save and compile the report.
Adding Fields to the Classic
Report Layout
After adding an additional table to the report dataset, you add and display the fields from the new table in the Classic report layout.
To add fields to the Classic report layout
-
With the report still open in Report Designer, on the View menu, click Sections to open Section Designer.
-
In Report Designer, select the Sales Line data item.
-
On the View menu, click Field Menu to open the Field Menu window, which lists the fields in the Sales Line table.
-
In the Field Menu window, select the new fields to display on the report. For this report, select the No., Document No., Shipment Date, Description, Quantity, Unit Price, and Line Amount fields.
 Note
NoteThe No. field is selected because you will use it later for grouping.
NoteTo select multiple fields in the Field Menu window, press the CTRL key while you select the fields.
-
Move the cursor into the Sales Line Body section of the layout. Click once to activate the window, and the cursor changes to the Control Insertion cursor. Place the cursor on the left side of the section, and then click again. A text box with an attached label is inserted for each field that you selected.
NoteYou may need to adjust the position of the labels and text boxes.
-
Close Section Designer, close the Field Menu window, and then save and compile the report.
Designing the RDLC Report Layout
in Visual Studio Report Designer
After you load the redesigned report in Visual Studio, you can define the report layout. When you open the report in Visual Studio, the new fields have not yet been added to the layout. However, all the fields that you added in the Classic client Report Designer are available from the Data Sources pane in Visual Studio. You can drag and drop them to add them to the report.
To design the RDLC report layout in Visual Studio Report Designer
-
With the report still open in Report Designer, on the View menu, click Layout to open the report in Visual Studio Report Designer.
-
In Visual Studio, click the table data region of the layout.
-
Right-click the left handle of the grouped row, and then click Delete Groups. This group does not include any data from the Sales Line data item. You will add a new grouping later in this walkthrough.
-
Right-click the left handle of the bottom row of the table, and then click Insert Row Below. Repeat this step to insert a second new row.
-
Drag the edges of the column headers to resize the columns so that you have six columns that are about equal width.
NoteYou do not need to resize the right-most seventh column.
-
For each row that you added and for each column that you resized, do the following to modify the font:
-
Select a row or column, and then on the View menu, click Properties Window.
-
In the Color field, enter Black.
-
In the Properties window, expand Font. In the FontSize field, enter 7pt.
-
-
In the Data Sources pane, expand DataSet, and then expand Result.
-
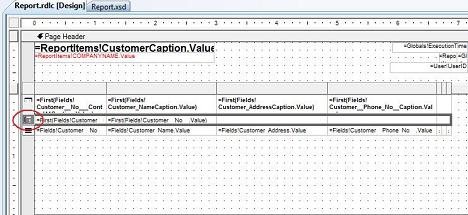
Drag and drop each of the following fields the Data Sources pane to the first empty row of the table data region of the report layout:
-
Sales_Line__Document_No__Caption
-
Sales_Line__Shipment_Date_Caption
-
Sales_Line_DescriptionCaption
-
Sales_Line_QuantityCaption
-
Sales_Line__Unit_Price_Caption
-
Sales_Line__Line_Amount_Caption
-
-
Drag and drop each of the following fields from the Data Sources pane to the last empty row of the table data region in the column that corresponds to the caption:
-
Sales_Line__Document_No__
-
Sales_Line__Shipment_Date_
-
Sales_Line_Description
-
Sales_Line_Quantity
-
Sales_Line__Unit_Price_
-
Sales_Line__Line_Amount_
-
-
Save the report in Visual Studio, and then close Visual Studio.
-
In the Classic client, select an empty line in Report Designer. A message informs you that the .rdlc file for this report has changed and asks if you want to load the changes. Click Yes to save the changes in the database.
-
On the File menu, click Save. In the Save window, verify that the Compile check box is selected, and then click OK to save and compile the report.
-
Open the RoleTailored client, and then run the report to see that the additional fields from the Sales Line table are added.
Adding Grouping and Totaling to
the Classic Report Layout
At this point, the customer sales order report does not show you how much each customer has ordered in total. By grouping and totaling data, your reports can contain information that is not otherwise readily available.
The report is based on two tables and lists customers and the customer sales lines that are related to each customer. In the Walkthrough: Designing a Customer List Report topic, you sorted the data by customer number when you created the report with the wizard. To provide statistics, you also want to group sales lines according to item number instead of printing all lines from all sales documents. Each line will then contain figures for the total quantity and the total amount for each item per customer. Also, it is useful to have a total amount per customer that shows how much each customer has on order.
To add grouping and totaling to the Classic report layout
-
In Report Designer for report 55551, select the Sales Line data item, and then on the View menu, click Properties.
-
In the Value field of the GroupTotalFields property, enter the name of the field that you want to use to group the records. For this report, use the No. field.
-
In the Value field of the DataItemTableView property, select a key that contains the field to group by. For this report, create a secondary key that consists only of the No. field in the Sales Line table. For more information, see How to: Define Primary and Secondary Keys.
NoteThis step is required because the fields in the GroupTotalFields property must also be fields in an active key of the underlying table. If the key that you select is a composite key, then the grouping can fail if there are other fields in the key before the grouping field and the contents of one of these fields change. You may need to create a distinct key for reports that access data in ways other than those that are used by your solution in general. For more information, see GroupTotalFields Property.
-
In the Value field of the TotalFields property, click the AssistEdit button.
-
In the Field List window, in an empty row, click the Lookup button to select the names of the fields for which totals should be calculated. For this report, on separate rows in the Field List window, select the Quantity and Line Amount fields. For more information, see TotalFields Property.
-
Save and compile the report.
Adding Grouping and Totaling to
the RDLC Report Layout in Visual Studio Report Designer
You have added grouping and totaling to the Classic report layout. Next, you do the same for the RDLC report layout.
To add grouping and totaling to the RDLC report layout
-
In the Classic client, on the View menu, click Layout to open the report in Visual Studio.
-
Click any field in the table data region of the layout.
-
Right-click the left handle of the second row in the table, and then click Insert Group. The second row contains the values from the Customer data item.
-
In the Grouping and Sorting Properties window, in the Name field, enter CustomerNo. This gives the group a name that is understandable and relates to the grouping field.
-
In the Group on: section, in the Expression field, select =Fields!Customer__No__.Value, and then click OK. This groups the data by customer.
-
Right-click the left handle of the first row in the group, which contains the values from the Customer data item, and then click Cut. Right click the left handle of the Grouping row, and then click Paste. This prevents the report from printing the customer information before every Sales Line row in the report. Instead, it prints the customer information once for each customer.
-
Right-click the left handle of the row in the table that contains the Sales Line data captions, and then click Insert Group.
-
In the Grouping and Sorting Properties window, in the Name field, enter SalesLineNo.
-
In the Group on: section, in the Expression field, select =Fields!Sales_Line_No_.Value, and then click OK. This groups data by item number in the Sales Line data item.
-
Cut and paste the row that contains the Sales Line data captions so that it is placed in the first grouping row.
NoteYou may need to delete empty rows in the table data region of the layout.
-
To add the total of the quantity per customer, do the following:
-
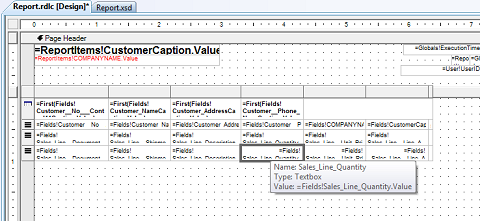
Drag and drop the Sales_Line_Quantity field from the Data Sources pane to the last row of the table, in the same column as the other Quantity text box.
-
Right-click the Sales_Line_Quantity text box, and then click Expression.
-
In the Expression window, verify that the expression is =SUM(Fields!Sales_Line_Quantity.Value), and then click OK.
-
-
To add the total of the amount, per customer, do the following:
-
Drag and drop the Sales_Line__Line_Amount_ field from the Data Sources pane to the last row of the table in the same column as the other Line_Amount text box.
-
Right-click the Sales_Line__Line_Amount_ text box, and then click Expression.
-
In the Expression window, verify that the expression is =SUM(Fields!Sales_Line_Amount.Value), and then click OK.
-
-
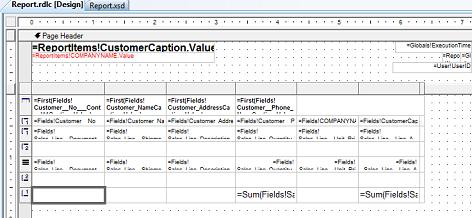
Save the report in Visual Studio. The following illustration shows the report after you have designed it in Visual Studio Report Designer.
Running the Modified Report
In the Classic client, you must now save the modified report and compile it before you can run it.
To run the modified report
-
In the Classic client, save the CustomerList report. A message informs you that the .rdlc file for this report has changed and asks if you want to load the changes. Click Yes to save the changes in the database.
-
On the Tools menu, click Compile to compile the report.
-
On the Windows taskbar, click Start, and then click Run.
-
In the Run window, enter dynamicsnav:////runreport?report=55551, and then click OK.
-
Click Preview to view the report.
See Also
Tasks
Walkthrough: Designing a Customer List ReportHow to: Make a Report Available in the RoleTailored Client
Walkthrough: Designing a Report with Images, Interactive Sorting, and Visibility Toggle
Walkthrough: Creating a Link from a Report to a Page
Concepts
Designing Reports for the RoleTailored Client© 2010 Microsoft Corporation. All rights reserved.